The PDAnalyze software is designed for the acquisition of measurement values and data analysis by all stand-alone particle measuring devices. It enables quick and easy analysis of particle sizes and concentrations using Promo, Promo mobile, Fidas, Fidas mobile, UF-CPC, U-SMPS, and U-RANGE
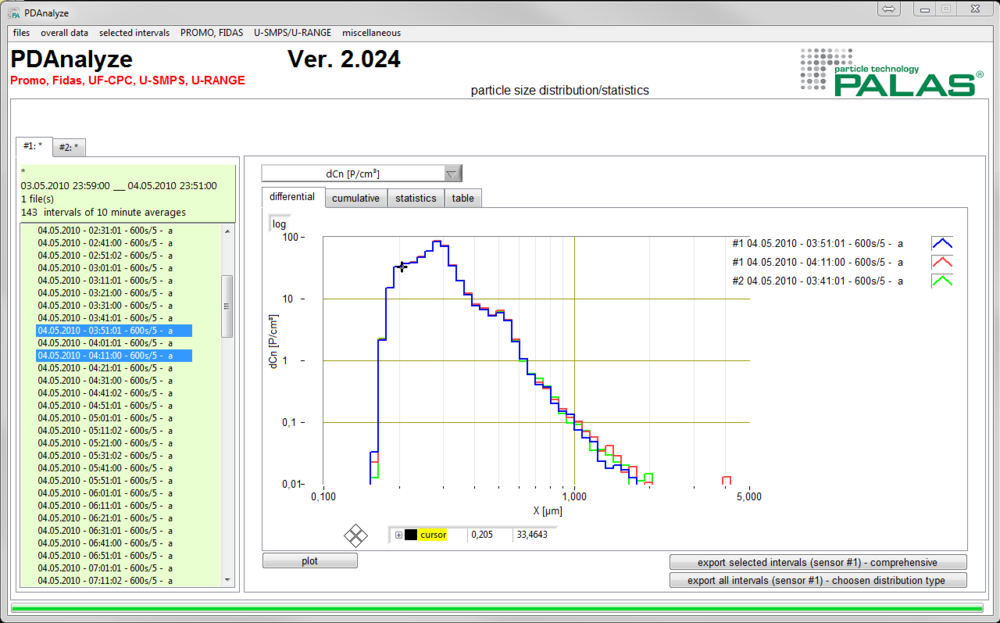
The PDAnalyze software provides special advantages for the analysis and comparison of concentration and particle size distributions using various types of displays and a uniform operating concept, regardless of the measuring device in use. In addition, it is also possible to set up a remote connection to measuring devices, which can be used to download measurement files and control measuring devices remotely.