Dust measuring device for comparing the dust formation of powders and bulk materials
Benefits
Description
Application
Benefits
High information content with respect to bulk material dust behavior
Ideal tool for quality assurance when handling with powdery goods
DustView II based on CIPAC MT 171
Fully automated, reproducible measuring process
Fully automated control and evaluation using on-board PC, no need for an external PC
Easy and intuitive operation using the touch screen
Rapid measuring process (40 s)
Compact and portable device
Comparison of multiple measurements
Individual measurements/serial measurements
Creation of reports as PDF, text file or printout
Reliable function
Self-calibrating by means of automatic offset adjustment
Automatic internal service message
Network-compatible
Low maintenance
Reduces your operating expenses
Description
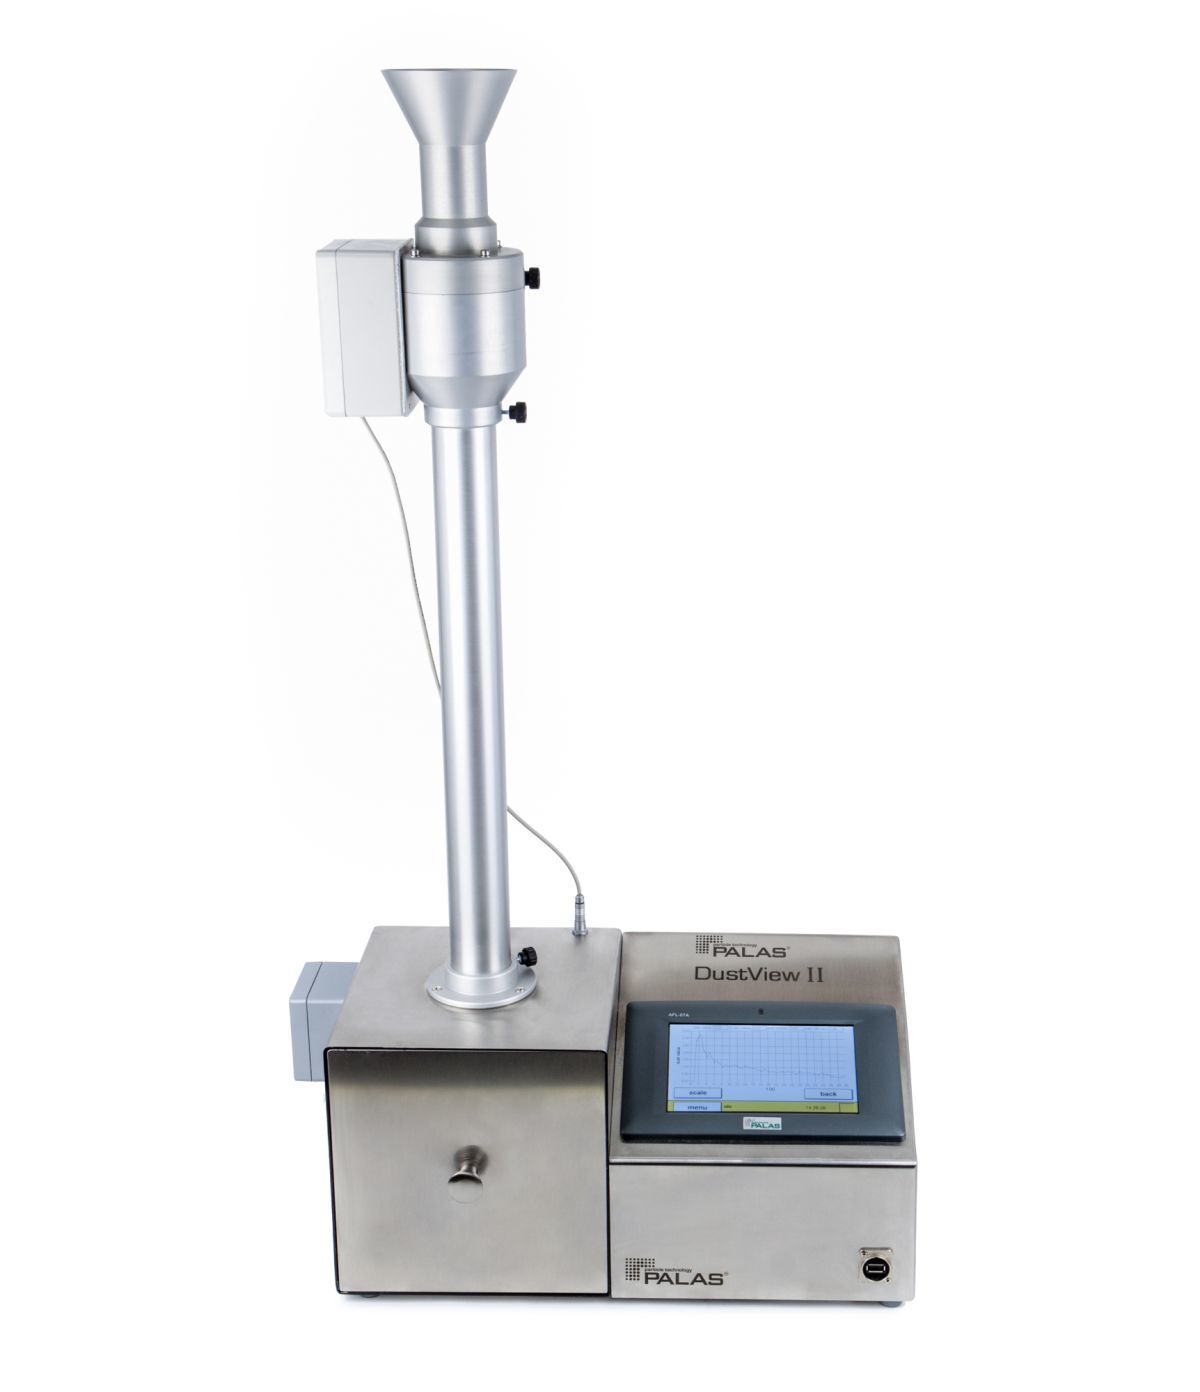
Fig. 1: DustView II
Dust is generated during the production, conveyance, and filling of powders, bulk materials, granulates, pellets, etc. This dust can have negative impacts on occupational safety and the reliability of production.
In addition, dust pollutes the environment and plays a not inconsiderable role in the loss of production.
The first essential step in the prevention of undesirable dust is to measure dust formation following free fall and impact.
The DustView II fully automated dust measurement system enables rapid and precise measurement of even the smallest fractions of dust generated following free fall and impact.
By means of the DustView II, the individual dust formation behavior can be determined quickly, clearly and reproducibly, so that the application of the system especially in the area of quality assurance of powders is outstandingly possible.
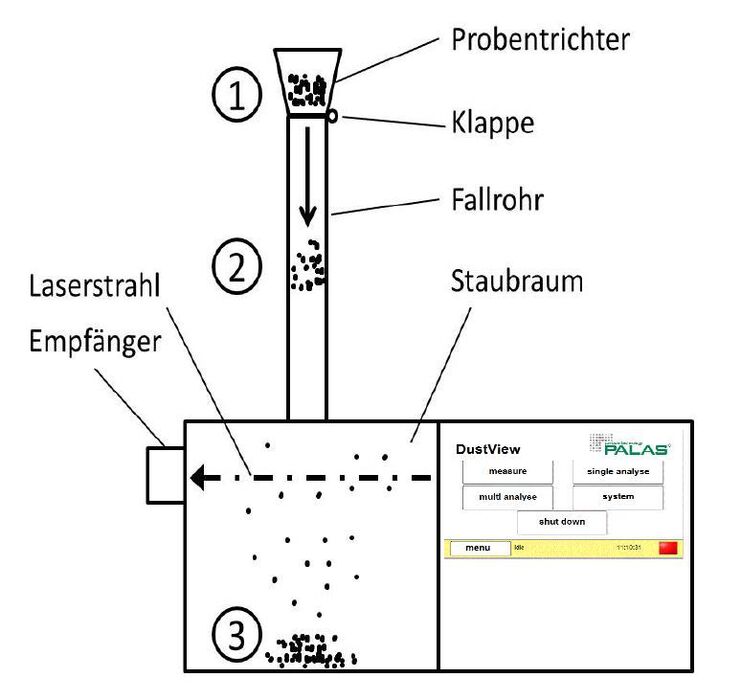
Principle of operation
Fig. 2: Schematic design of the DustView II
Pour the sample (typically 30 g bulk material) into the sample funnel.
Start of measurement: Valve opens automatically and sample falls into dust reservoir.
Measurement begins immediately after the valve opens.
The dust is dispersed in the reservoir. The resulting dust development causes an attenuation of the laser beam (extinction measurement). This attenuation is observed during measurement and classified as a dust value between 0 and 100 0 = No attenuation of the laser beam due to dust development,
i.e. there are only minor dust fractions in the reservoir 100 = Complete attenuation of the laser beam due to dust
development
The dust values change over time and indicate the attenuation of the laser beam in relation to the 0 value (= no attenuation). The 0 value is automatically determined without dust prior to each measurement (calibration).
End of measurement and automatic storage of the data
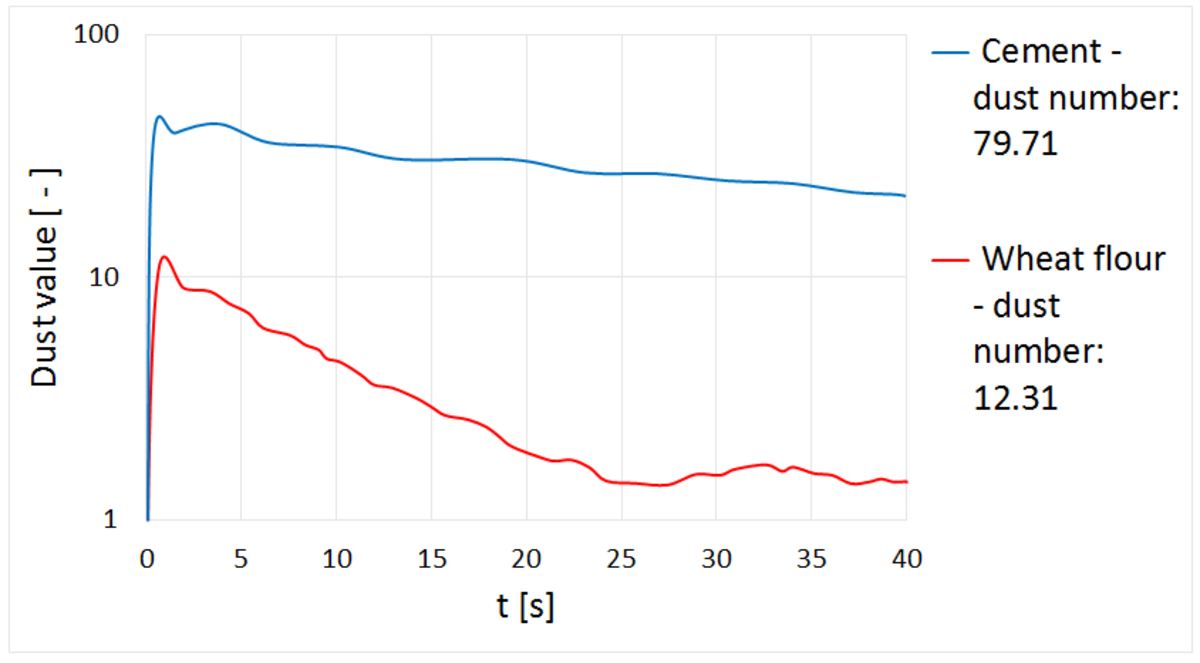
Determination of the dust number as a reference value for dust behavior
The dust number (STZ) consists of the maximum dust value and the dust value indicated 30 seconds after the maximum dust value has been reached:
Dust number (STZ) = Max. value + 30-s value
Measurement results (example)
Fig. 3: Comparison of two bulk materials
Due to its finer particle size distribution and the specific characteristics of the material, the cement sample clearly generates more dust than the wheat flour sample. Wheat flour contains considerably larger particles that quickly settle to the bottom of the reservoir, while nearly all of the finer cement particles remain suspended in the air even after 30 s.
These comparisons enable a product to be easily and verifiably optimized with respect to dust behavior.
The high reproducibility of these measurements enables easy and economical production controls of bulk materials.
Firmware and software
Following completion of the measurement, the results are displayed directly on the device and are shown as numerical values and in the form of a chronological sequence. Automatic storage of the results enables the analysis of earlier measurements without an additional PC.
The system provides the option to create reports as a PDF or text file. In addition, a report can be printed out immediately using a printer.
In addition to the analysis of individual measurements, the DustView II firmware also enables the comparison of up to ten different measurements. The report creation options mentioned above are also available here.
Multiple measurements can also be averaged easily and quickly using the series measurement option.
Evaluation software for the analysis of measurements on an external PC is also included.
The DustView II measurement device was developed during the AIF Pro INNO II Research project
(KF 0295803WZ8) in cooperation with the Bergischen Universität
Wuppertal, Prof.-Dr. E. Schmidt during the time 2008 and 2010.
Application
Quality control
Product development
Process optimization
Occupational safety
To enquire about the DustView II Laboratory fine dust measuring devices and the options available contact us now.
This website uses cookies so that we can provide you with the best user experience possible. Cookie information is stored in your browser and performs functions such as recognising you when you return to our website and helping our team to understand which sections of the website you find most interesting and useful.
Strictly Necessary Cookies
Strictly Necessary Cookie should be enabled at all times so that we can save your preferences for cookie settings.
If you disable this cookie, we will not be able to save your preferences. This means that every time you visit this website you will need to enable or disable cookies again.